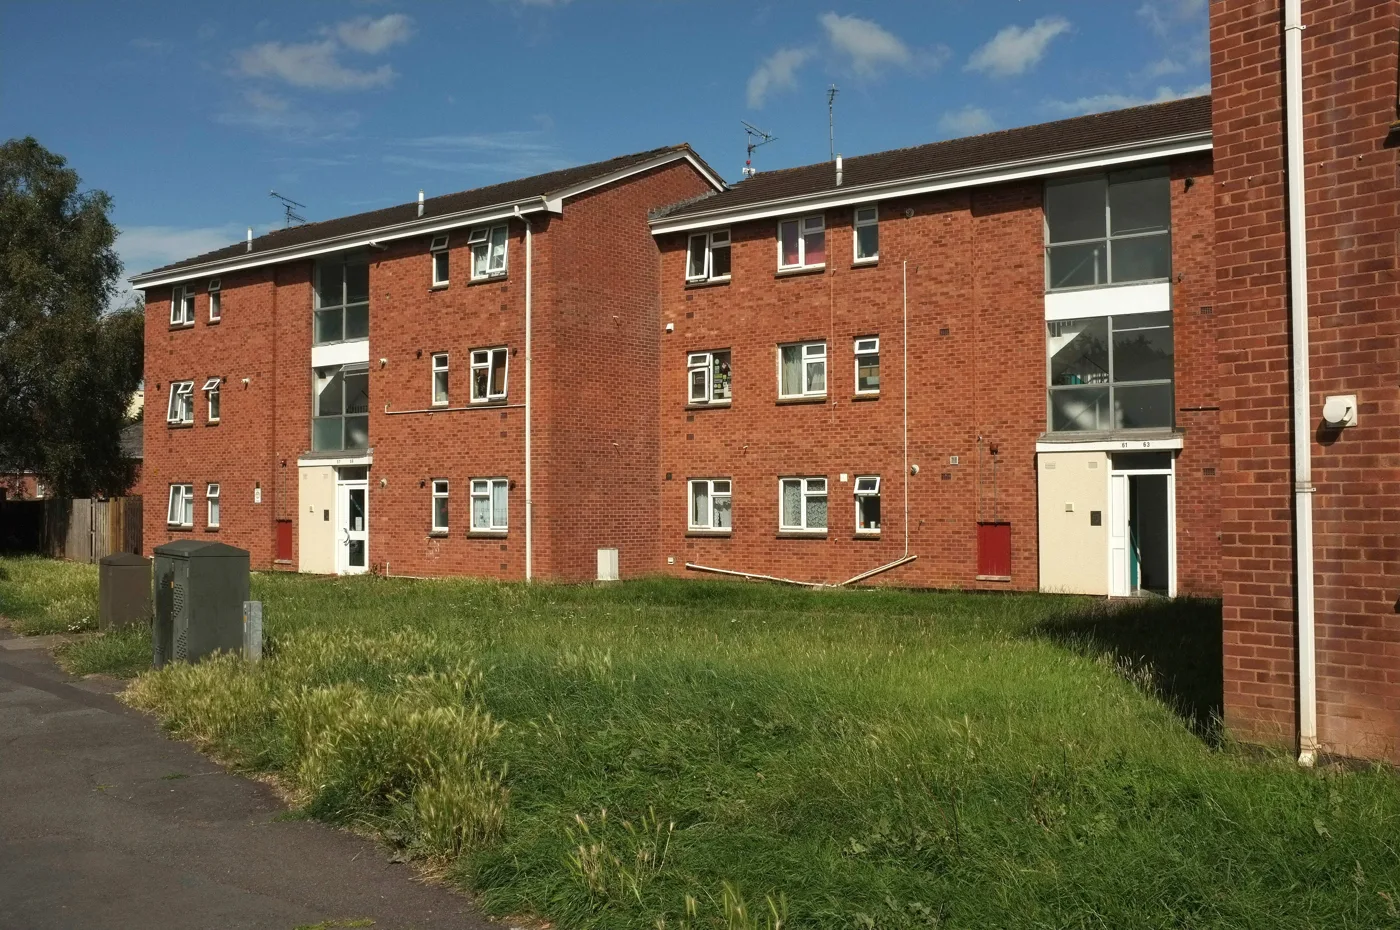

Exeter flats averaged £164,900 in July, a price the city last saw in 2021. The average home across all types fell £4,907 in a year to £282,696.
The average Exeter flat sold for £164,900 in July 2026. That is a price the city has not seen since 2021. Apart from June this year, the last month the Exeter flat average sat at or below it was July 2021, five years ago. (UK House Price Index, Exeter, July 2026)
Flats are down 4.7% over the year, the steepest fall of any property type in the city. Every other type fell too, but by much less.
Across all types the average Exeter home came to £282,696. That is £4,907 less than a year earlier, a fall of 1.7%. It is also £2,053 more than June, because the city bounced slightly off what is so far the low point of 2026.
One thing to be clear about before any of these numbers are used: the UK House Price Index is a mean average, not a median. A single large sale moves it.
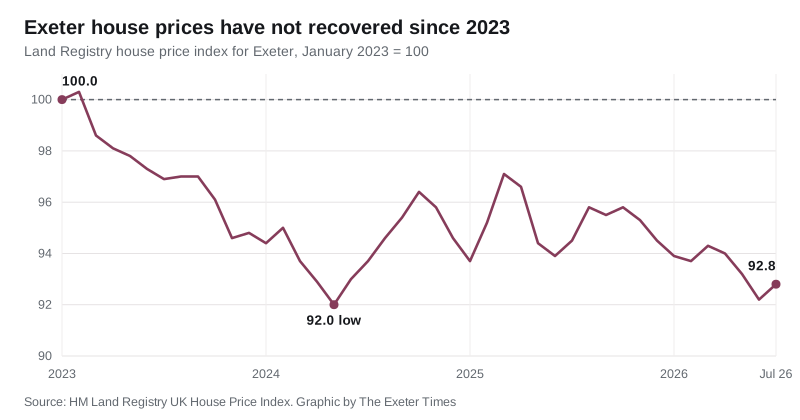
Exeter is still below where it was in January 2023
The index gives every area a number with January 2023 set at 100. Exeter’s July reading is 92.8. In cash, the average Exeter home was £304,496 in January 2023 and is £282,696 now, a fall of £21,800, or 7.2%.
That is the part that does not show in a monthly headline. Exeter has not had a crash. It has had three and a half years of drift. The index bottomed out at 92.0 in May 2024, climbed back to 97.1 in March 2025, and has given all of that back since. June 2026, at 92.2, was the lowest month of this year.
Where Exeter sits in Devon
The index covers every district in the county on the same day and the same basis, which makes the comparison a fair one. Ranked by annual change in the year to July, Exeter is third from the bottom of the ten Devon and Plymouth areas.
| Area | Average price | Annual change |
|---|---|---|
| Plymouth | £223,161 | +2.2% |
| Torridge | £263,378 | +1.7% |
| East Devon | £339,683 | +1.3% |
| Mid Devon | £281,450 | +0.1% |
| Teignbridge | £302,368 | +0.1% |
| West Devon | £285,834 | -0.6% |
| Torbay | £222,118 | -1.6% |
| Exeter | £282,696 | -1.7% |
| North Devon | £282,633 | -2.4% |
| South Hams | £355,483 | -5.3% |
The wider picture is that Exeter is falling while the country is not. England rose 1.1% over the same twelve months to £293,479, so a typical English home now costs about £10,783 more than a typical Exeter one. Devon as a county fell 0.8% and the South West fell 0.2%, so Exeter is going down faster than both.
Exeter is the city with the university, the hospital, the county council and the regional offices, and it is where the M5 stops. It sits below the Devon county average of £303,491, and below both the districts it borders: Teignbridge at £302,368 and East Devon at £339,683.
Flats are doing the damage
Every property type in Exeter fell over the year. Flats fell nearly three times as fast as the next worst.
| Type | Average price | Annual change |
|---|---|---|
| Detached | £517,757 | -1.7% |
| Semi-detached | £346,054 | -0.5% |
| Terraced | £282,887 | -0.9% |
| Flat or maisonette | £164,900 | -4.7% |
The flat market is not only an Exeter problem. England’s flat average fell 3.5% over the same year, Devon’s fell 3.6% and the South West’s fell 3.2%, at a time when England’s semi-detached houses rose 2.7%. Buyers across the country have been moving away from flats. Exeter’s -4.7% is worse than all three of those benchmarks.
What is specific to Exeter is how far the flat average has travelled. It peaked at £189,331 in October 2022. At £164,900 it is now £24,431 below that peak, a fall of 12.9%, and it has spent June and July at levels the city last recorded in 2021.
That matters here more than it would in most Devon towns, because Exeter has more flats to sell. The city has two universities’ worth of student demand, a city-centre conversion market, and a pipeline of purpose-built schemes: the Heavitree Road police station site alone is an 813-studio student and co-living scheme that has been sitting in the planning system without permission for nine months.
What it means for you
If you are selling a flat in Exeter. The index is a lagging measure, built from completed sales, so it describes what has already gone through rather than what is being asked now. But it says plainly that a flat sold in July went for about £8,100 less on average than the same kind of flat a year earlier. Price to that, not to a 2022 valuation.
If you are buying your first home. The first-time buyer average in Exeter is £243,505, against £245,515 across England. This is one of the few measures on which Exeter is now cheaper than the national figure.
If you are buying a house rather than a flat. The fall is much smaller. Semi-detached homes are down 0.5% and terraced homes 0.9% over the year, which at these prices is £1,867 and £2,690 in cash. That is well inside the range a single strong or weak month of sales can produce.
If you are worrying about a remortgage. A 7.2% fall since January 2023 matters only if it takes you past a loan-to-value band. On the average Exeter home that is £21,800 of equity, and on a flat bought at the October 2022 peak it is £24,431.
If you own in the wider district. These figures are for the Exeter City Council area. Prices in the villages just outside it are counted in East Devon or Teignbridge, and both are doing better than the city this year.
How this is measured
The UK House Price Index is published monthly by HM Land Registry from the Land Registry’s own record of completed sales, which is why it runs about two months behind. It is a mean average, not a median, and it is adjusted for the mix of property types sold. Figures for recent months are revised as more sales are registered, sometimes by a few hundred pounds.
That revision is not theoretical. When we reported the June figure on 19 August, Land Registry had Exeter at £280,982 and an annual fall of 1.7%. The same month now reads £280,643 and -1.8%. We have added a dated note to that article.
The next release, covering August 2026, is due in the middle of October.
Sources
- UK House Price Index, Exeter, July 2026, HM Land Registry, for the city average, the index value, the split by property type and the first-time buyer average.
- UK House Price Index, England, July 2026 and the same series for Devon and the South West, for the comparisons.
- The same index for each Devon district and for Plymouth and Torbay, for the ranking table.
- About the UK House Price Index, HM Land Registry, for the method, the mean basis and the revision policy.
Published by The Exeter Times on 20 September 2026. Figures are Land Registry’s own and are revised as more sales are registered.
Have your say